Online Security
This week we learned about online security, which included how to protect your online accounts, what kind of data your online activities generate, and information about viruses such as the heart bleed virus that has been publicized recently.
I would say that my online activities are pretty safe and protected. All of my passwords for my various online accounts are different, and are never anything easy. As annoying as it can be to have to include numbers, letters, symbols, a hieroglyphic and the blood of a virgin included in every new password that a website has you create, it is definitely for a reason. All of my passwords are long and complex, I’m always super hesitant to download anything, I never enter my credit card information on anything that isn’t an organization that I am extremely familiar with, and I don’t visit websites that aren’t secure. But there’s only an extent to which you can protect yourself. Sometimes viruses, like the heart-bleed just find you. I think that ironically, technology enables us to be protected from other technology. Who hasn’t gotten an email along the lines of, “There’s a virus going around. This is ho it’s embedded. This is how it attacks you.”
My online activities generate a lot of different data, in a lot of different places and purposes. I have a lot of online work that has been published for the Human Rights Campaign’s website. I have written a lot of various poetry, prose, and spoken word that was just for my own enjoyment and has been published to mainly Tumblr, as a means of self expression and communication with others. I do a lot of researching, blogging, and creation on the internet. I also use it mainly for social interaction, such as Facebook and tumblr. The majority of the data that I generate is creative, and word based.
One thing that I found interesting about the NASA article is that they don’t actually look at your data, just your metadata. They’re simply looking for “trigger words” or “tip-offs of sorts” so that they can look for anything that might be problematic. It’s just the skeletons of what an online user is actually generating, not the actual content. Americans make such a big deal about the government invading their privacy, when they don’t actually know what the government is looking for.
As far as my project goes, I think I’m making good progress on it. I’m always finding new items to add to my site, but I’m honestly worried that my project is somehow going to fall short, or be missing something. Next week during class, I’m hoping to meet personally with Professor Hajar and do a check-in to see how I’m coming along, or if she has any suggestions to what I might want to add.
Filed under Final Project, Tools | Comment (0)
iCharts
I’ve had a little bit of trouble finding statistical data to interpret and put into a chart, because my topic isn’t really recorded in numbers. It’s especially hard to find data from the time period that involved LGBT people, since the government was trying not to draw attention tot he movement, or to the existence of such people. However, I did find a dataset that had recorded the percentages of self identified LGBT by state. People were surveyed in each state, and asked how they identified their sexual orientation. The data then shows what percentage of the total state population identifies as LGBT.
Through this research, you can clearly see that DC is the state (or district) that has the highest population of LGBT people, with a total of 10%. While this data is current, and not from the time period in which my research is directly focused on, it is still relevant to my topic because it shows the lasting impact of the movement in DC. Because District of Columbia is where the heart of the political side of the movement was born, this makes sense as to why the population is highest here. Clearly, the movement has accomplished something in present day places for LGBT people to feel safe and continue to reside.
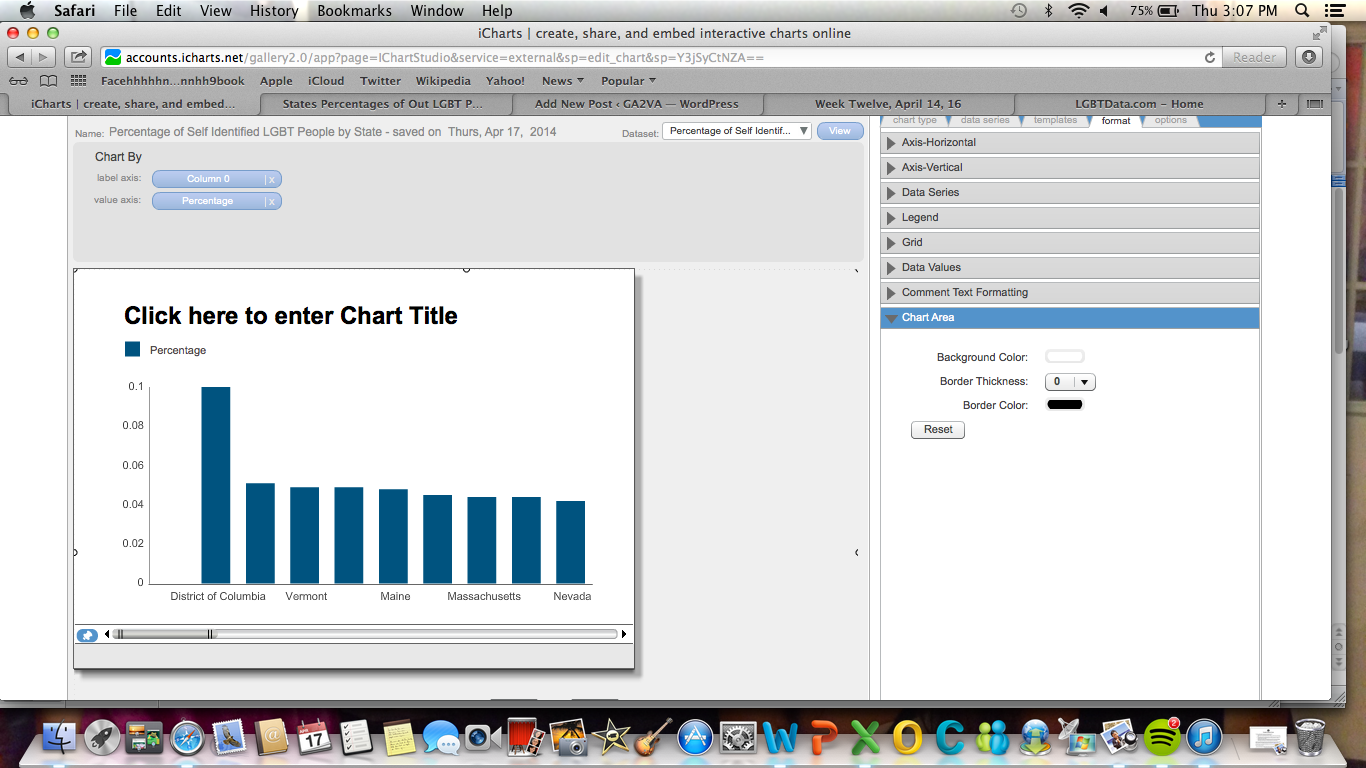
As you can see in the chart, DC has a 10% LGBT population. To see the full chart, you can go to this link: http://www.icharts.net/chartchannel/click-here-enter-chart-title_mhrryijbc
I’m going to continue searching for relevant data from the 1960s-1980s, when the movement was occurring, that might help to clarify my research question, but I thought that this was a decent start.
Filed under Final Project, Tools | Comment (0)Week Ten
This week we played around with Ngram Viewer and Voyant, and learned about text mining. From what I experimented with, it was a bit overwhelming, but helpful. I had no idea that you could literally go “mining” for texts and narrow your results like that. I think that the tools are definitely valuable, and could really come in handy when you need to analyze a lot of material for specific things quickly. But honestly, we learn about so many different things in this class that I know I will never diligently use all of them in my daily life. Wordle was pretty cool, but it didn’t seem like something I would realistically use. I will probably start using Voyant, because it seems the most applicable.
This week I’ve made some good progress on my topic, and my project. I narrowed down my focus, and so now I know what I really need to be researching as opposed to just looking for random LGBT history things about DC. I’m now focusing on Frank Kameny and his contribution to the early movement, because it’s a better topic, and there’s a ton to learn about it, as well as a ton of information. I’ve added a couple good items to Omeka, because now I’m finding much better material.
Filed under Final Project, Tools | Comment (0)